
Paired Sample t-test
- Hussam Omari
- 12 فبراير 2023
- 2 دقيقة قراءة

What is Paired Sample t-test?
In the previous article, the t-test - Comparison of Two Sample Means was defined as a type of inferential statistics used to determine if there is a significant difference between the means of two independent groups. A paired sample t-test is also used to determine if there is a significant difference between the means of two groups but these two groups are dependent or have a natural pairing. The Paired Samples t-test is commonly used to test the following:
Statistical difference between two time points
Statistical difference between two conditions
Statistical difference between two measurements
Statistical difference between a matched pair
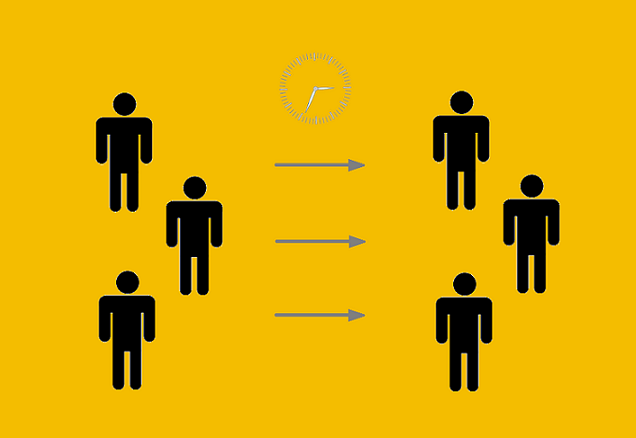
In most cases of paired t-test designs, each subject is measured twice, resulting in pairs of observations. In other words, the data in a pair are linked by virtue of being measurements on the same person or entity. Therefore, this test is also known as repeated measures t-test or dependent t-test.
Assumptions
As a parametric procedure, the paired sample t-test makes several assumptions. The paired sample t-test has four main assumptions:
The dependent variable must be continuous (interval/ratio).
The observations are independent of one another.
The dependent variable should be approximately normally distributed.
The dependent variable should not contain outliers.
Example
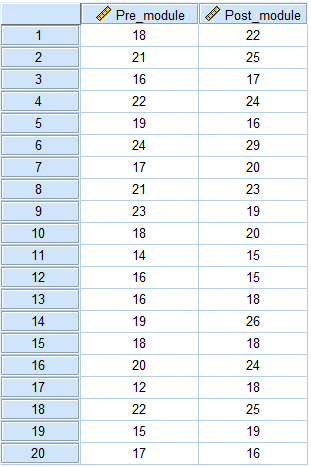
Suppose a sample of 20 students were given a diagnostic test before studying a particular module and then again after completing the module. We want to find out if our teaching leads to improvements in students’ knowledge (test scores). Table 1 shows the 20 students' test scores data.
Table 1: Students' test scores before and after completing the module
In this example, we used the SPSS software to obtain paired t-test results of our sample of the 20 students to draw conclusions about the impact of this module as shown in Figure 1.
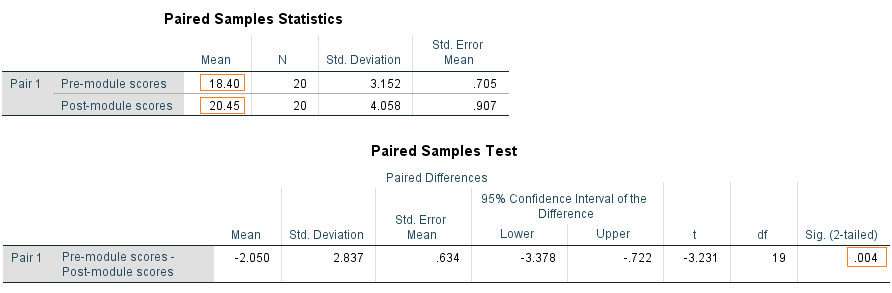
Figure 1: Paired t-test results of our sample of the 20 students
Note that the mean test scores of the students before the application of the module was 18.40 and after the module the mean increased to 20.45. Now, we need to know if there is a significant difference between these two test scores means.
To do so, we look at the Sig. value which is 0.004, and since this value is less than 0.05, we can say that there is significant difference between the two test score means and students showed an improvement in their test scores after the teaching module compared to their scores before the module.
References
Mendenhall, W. M., & Sincich, T. L. (2016). Statistics for Engineering and the Sciences Student Solutions Manual (6th ed.). USA: Taylor & Francis Group, LLC.
Weiss, N. A., & Weiss, C. A. (2012). Introductory Statistics (9th ed.): Pearson Education, Inc.
https://www.statstutor.ac.uk/resources/uploaded/paired-t-test.pdf


تعليقات