
Top Python Libraries for Data Analysis - with Examples
- Hussam Omari
- Sep 19, 2022
- 9 min read

Updated: Nov 24, 2022
Table of Contents
What is Python?
Python is a multipurpose programming language and one of the most popular and rapidly growing high-level programming languages worldwide. Python is commonly used in many areas such as software development, machine learning, artificial intelligence, and data science including data analysis and data visualization. In addition to other uses such as system scripting and web development.
Python is easy to use and learn and it is also characterized by the ability to extend its functionality by importing numerous libraries and modules available. Theses libraries give data scientists the necessary functionality and provide a complete set of tools for specific operations (e.g. data analysis) instead of writing codes from scratch.
In this article, we introduce the major Python libraries that are commonly used for data analysis and how to utilize them by providing code examples for each library.
What is a Library in Python?
To understand what Python library is, we need to understand modules in Python. A module is simply a file with collection of codes (functions and methods) that can be imported and utilized in a Python program.
A library (package) is a collection of related modules that we can utilize in a program for specific operations. Libraries in Python are essential and useful because they eliminate the need to write the code or functions in our program since they are already available in the library.
When we link a library with our program and run that program, the linker automatically searches for that library. It extracts the functionalities of that library and interprets the program accordingly. That is how we use a library functions in our program.
Installing Libraries in Python
Before installing any library, it is better to make sure you have the expected Python version available by opening the Windows Command Prompt (Figure 1) from the Start Menu, and then typing the following command:
py --version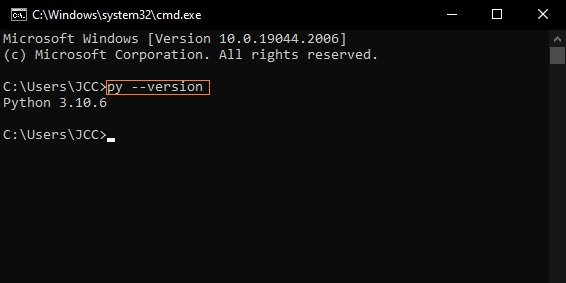
Figure 1: Checking Python Version
You should get some output like Python 3.8 or higher such as Python 3.9 or 3.10. If you do not have Python or the required version, install Python 3.8 or higher from python.org. For more details, you can refer to the Python Basics article or Python Installation guide.
Next, you can install a Python package by opening the Command Prompt, and then typing the following command:
pip install package_nameSuppose we need to install a Python package called "Pandas". From the Start Menu, open the Command Prompt (Figure 2) and type the following command and press Enter:
pip install pandas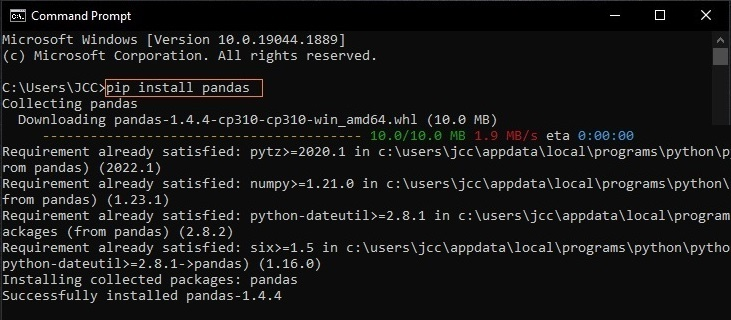
Figure 2: installing Pandas package
In case the Pandas library is already installed in your system, you will get a message stating that the "requirement is already satisfied".
Importing Python Libraries
While we are writing a program or analyzing data on our favorite Python IDE such as VS code, Spyder, PyCharm, etc., we often need to import one or more libraries or modules to utilize their functions for specific operations. To import a library or a module to use in our program or data analysis process, we simply use the import statement:
import package_nameFor example, we can import Pandas library using the following code:
import pandasWhen importing a library, we often use alias names for many libraries using import...as statement. Alias names are just used to give a library a shortened name while using its functions.
Example:
import pandas as pdWe can also import specific items from a library or module using from…import. These items could be functions, methods or classes within that specific library. In the code below instead of importing the entire Random module, we are just importing randint method.
from random import randintNote: the randint method is used to create a random integer within a certain range, as shown in the following example:
# Import randint method:
from random import randint

# Generate a random number between 1 and 10:
r = randint(1, 10)
print(r)

# Note: Every time you run this code, you will get a different integer between 1 and 10
Python Libraries for Data Analysis
As we previously mentioned, a library (package) is a collection of related modules that can be utilized in a program for specific operations. There are several modules and libraries in Python that make a programmer's life easier when working with data. These libraries include the following:
1. Math Module
The math module is a built-in module, therefore you can directly import and use it without the need for prior installation.
This module provides mathematical functions to deal with both basic operations such as addition (+), subtraction (-), multiplication (*), division (/) and advance operations such as trigonometric, logarithmic, exponential functions. It also provides various constants, like Euler’s Number (e), pi (π), and tau (𝜏), to save the time of writing the value of each constant every time we need it.
Example: Some functions of Math module
# Import math module
import math

# Return the square root of 9:
print(math.sqrt(9))
# Return the remainder of 7/2:
print(math.fmod(7, 2))
# Return the natural logarithm of 6:
print(math.log(6))
# Print the value of pi:
print(math.pi)
Output:
3.0
1.0
1.791759469228055
3.141592653589793
For more Math module functions, visit the following page:
2. Statistics Module
This module is also a built-in module and provides functions for calculating simple mathematical statistics of numeric data type. The statistics module is commonly used for descriptive statistics such as measures of central tendency (e.g. mean, median and mode), measures of spread (e.g. variance and standard deviation), and statistics for relations between two inputs such as Linear correlation and regression.
Example: Some functions of Statistics module
import statistics

# Create data (lists):
x = [5, 7, 13, 8, 11, 12]
y = [20, 22, 30, 34, 35, 19]

# Return the mean of x values:
print(statistics.mean(x))

# Return the standard deviation of x values:
print(statistics.stdev(x))

# Return the correlation coefficient for x and y:
print(statistics.correlation(x, y))
Outputs:
9.333333333333334
3.141125063837266
0.3153284249209401
For more Statistics module functions, visit the following page:
3. NumPy
NumPy constitutes the core of many other Python libraries that have originated from it. NumPy is written partially in Python, while most of the parts that require fast computation are written in C and C++.
NumPy is the fundamental library for scientific computing in Python which provides a high-performance multidimensional array object, various derived objects (e.g. matrices), and functions for working with these arrays including basic linear algebra, Fourier transform, random simulation, and basic statistical operations.
Arrays are simply a data structure (lists) having elements with same data type. An array class in Numpy is called as ndarray which stands for N-dimensional array.
One of the main differences between lists and arrays that lists store elements that are of various data types at the same time (e.g. integers, strings, etc.), while arrays store only the same single data type.
Arrays are ordered and indexed; meaning that each value in an array has an index number, which can be used to tell us the position of any element in that array. The indexes in NumPy arrays start with 0, meaning that the first element has index 0, and the second has index 1, etc.
Example:
# Import numpy library:
import numpy as np

# Create 2-D (rank 2) array:
my_array = np.array([[1, 2, 3, 4],[5, 6, 7, 8]])

# Return the type of my_array:
print(type(my_array))

# Return the number of elements in each dimension:
print(my_array.shape)

# Return specific element using indexing:
print(my_array[0, 0], my_array[0, 1], my_array[1, 1])
Outputs:
<class 'numpy.ndarray'>
(2, 4)
1 2 6
For more details about NumPy fundamentals and functions, visit the following pages:
4. SciPy
SciPy is a scientific library used for mathematics, science, and engineering. It is built on NumPy and provides convenient and fast N-dimensional array manipulation. This library has optimized and added functions that are frequently used in NumPy and Data Science.
SciPy is composed of sub-modules designed for various tasks such as linear algebra, numerical integration, interpolation, image processing, signal processing, and Statistical distributions and functions.
Example: Some Scipy basic descriptive statistics functions
# Import libraries:
from scipy import stats
import numpy as np

# Create an array:
x = np.array([1,2,3,4,5,6,7,8])

# Return the maximum value:
print(x.max())

# Return the minimum value:
print(x.min())

# Return the mean (average):
print(x.mean())

# Return the variance:
print(x.var())
Output:
8
1
4.5
5.2
Example: Calculating the t-test for the means of two independent samples
# Import SciPy library:
from scipy import stats

# Creating normal continuous random data:
rvs1 = stats.norm.rvs(loc = 5, scale = 10, size = 500)
rvs2 = stats.norm.rvs(loc = 5, scale = 10, size = 500)

# Calculating t-test:
print(stats.ttest_ind(rvs1,rvs2))
Outputs:
Ttest_indResult(statistic=2.360375241770261, pvalue=0.018448025920982086)Scipy is used for several scientific computing purposes and contains various functions, therefore it is not possible to illustrate SciPy capabilities with few examples. For more details about SciPy fundamentals and functions, visit the following pages:
5. Pandas
Pandas is a powerful and easy to use data analysis and data manipulation library, built on top of Numpy. Pandas is very important library for data science and data analysis because it provides numerous functions for analyzing, cleaning, exploring, and manipulating data.
Pandas generally provide two data structures for manipulating data:
Series
DataFrame
A Pandas Series is a one dimensional array holding data of any data type. You can imagine a Series as a column in a table (Figure 3).
Example:
# Import pandas library:
import pandas as pd

# Create a list:
x = [95, 84, 89, 77]

# Create series from the list:
a = pd.Series(x)

# Return series data:
print(a)
Output:
0    95
1    84
2    89
3    77
Figure 3: Series illustration
DataFrames are a two dimensional data structure with labeled axes (rows and columns). You can imagine a DataFrame like a table in an Excel Sheet in which data is aligned in a tabular fashion in rows and columns (Figure 4).
Example:
# Import Pandas library:
import pandas as pd

# Initialize a data of lists.
data = {'Name': ['Sami', 'Nick', 'John', 'Ahmad'],
        'Age': [19, 22, 18, 23]}

# Create a DataFrame:
df = pd.DataFrame(data)

# Return the DataFrame:
print(df)
Output:
    Name  Age
0   Sami   19
1   Nick   22
2   John   18
3  Ahmad   23

Figure 4: DataFrame illustration
Often, a Pandas DataFrame is created by importing the datasets from existing storage such as SQL Database, CSV file, or Excel file.
As we previously mentioned, Pandas provides various functions and methods for data manipulation and analysis. For Pandas fundamentals and functions, visit the following pages:
6. Statsmodels
Statsmodels is a module created on top of the SciPy and NumPy libraries. This module supports specifying models using R-style formulas and Pandas DataFrames.
Statsmodels provides classes and functions for the estimation of many different statistical models, as well as for conducting statistical tests and statistical data exploration, such as linear regression, logistic regression, multivariate analysis, generalized linear models (GLM), time series analysis, and survival analysis.
Example:
# Import libraries:
import numpy as np
import statsmodels.api as sm
import statsmodels.formula.api as smf

# Load data:
dat = sm.datasets.get_rdataset("Guerry", "HistData").data

# Fit regression model (using the natural log of one of the regressors):
results = smf.ols('Lottery ~ Literacy + np.log(Pop1831)', data=dat).fit()

# Return the results:
print(results.summary())
Output:

The documentation of the Statsmodels is available at:
7. Matplotlib
Matplotlib is a powerful multi-platform data visualization library in Python. Data Visualization is the graphic representation of data. Both Matplotlib and Seaborn are deemed as the backbone of data visualization in Python.
Matplotlib provides static, animated, and interactive visualizations including bar graphs, pie charts, boxplots, histograms, line charts, and scatter plots.
Most of the Matplotlib utilities lies under the pyplot submodule which provides a MATLAB-like interface, and is usually imported under the plt alias.
Example:
# Import Libraries:
import matplotlib.pyplot as plt
import pandas as pd

# Initialize a data of lists.
data = {'Name': ['Sami', 'Nick', 'John', 'Ahmad'],
        'Age': [19, 22, 18, 23]}
# Create a DataFrame form data:
df = pd.DataFrame(data)


# Plot data using pyplot:
plt.bar(df["Name"], df["Age"])
# Add labels:
plt.xlabel("NAME")
plt.ylabel("AGE")

# Show the chart:
plt.show()
Output:

For more details about Matplotlib fundamentals and functions, visit the following pages:
8. Seaborn
Like Matplotlib, Seaborn is an amazing Python data visualization library. It is based on Matplotlib and integrates closely with Pandas data structures (e.g. DataFrame).
This library provides a high-level interface for drawing attractive and informative statistical graphics including bar graphs, pie charts, boxplots, histograms, line charts, and scatter plots.
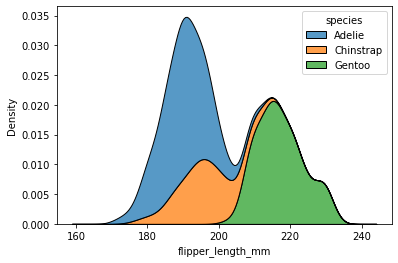
Example:
# Import Seaborn library:
import seaborn as sns

# Load data:
df = sns.load_dataset("penguins")

# Plot data:
sns.kdeplot(data=df, x="flipper_length_mm", hue="species", multiple="stack")
Output:
A major difference between seaborn and Matplotlib is that Seaborn is relatively more organized and utilizes simpler syntax to understand and learn, while Matplotlib utilizes relatively lengthy and more complex syntax.
For more details about Seaborn fundamentals and functions, visit the following pages:
References
Matthes, E. (2019). Python crash course: A hands-on, project-based introduction to programming: no starch press.
Morgan, P. (2016). Data Analysis From Scratch with Python: AI Sciences LLC.
Nelli, F. (2015). Python data analytics: Data analysis and science using PANDAs, Matplotlib and the Python Programming Language: Apress Media, LLC.
VanderPlas, J. (2017). Python data science handbook: Essential tools for working with data. USA: O'Reilly Media, Inc.
J. D. Hunter, "Matplotlib: A 2D Graphics Environment", Computing in Science & Engineering, vol. 9, no. 3, pp. 90-95, 2007.
Data structures for statistical computing in python, McKinney, Proceedings of the 9th Python in Science Conference, Volume 445, 2010.
Harris, C.R., Millman, K.J., van der Walt, S.J. et al. (2020). Array programming with NumPy. Nature 585, 357–362. DOI: 10.1038/s41586-020-2649-2.
Virtanen P. et al. (2020) SciPy 1.0: Fundamental Algorithms for Scientific Computing in Python. Nature Methods, 17(3), 261-272.


Comments