
The Chi-Square Test & Phi Coefficient
- Hussam Omari
- Apr 19, 2022
- 4 min read

Updated: Dec 27, 2022

A chi-square test is a statistical procedure used to compare observed results with expected results. The main purpose of this procedure is to determine if a difference between observed data and expected data is due to chance or due to a relationship between the variables under study. There are three types of chi-square tests:
1. The chi-square goodness-of-fit test (one-way chi-square test).
2. The chi-square independence test (two-way chi-square test).
3. The chi-square homogeneity test.
In this article, we discuss the chi-square independence test (two-way chi-square test) because it is one of the most commonly used procedures for determining whether an association (relationship) exists between two variables of a population when we have the bivariate data.
Chi-Square Distribution
The statistical-inference procedures discussed in this article rely on a distribution called the chi-square distribution. Chi is a Greek letter whose lowercase form is χ. A variable has a chi-square distribution if its distribution has the shape of a special type of right-skewed curve, called a chi-square (χ2) curve. Actually, there are infinitely many chi-square distributions, and we identify the chi-square distribution (and χ2-curve) by its number of degrees of freedom. Figure 1 shows three χ2-curves and illustrates some basic properties of χ2-curves.


Figure 1: Three different chi-square curves and their properties
Chi-Square Independence Test
Chi-Square independence (two-way chi-square test) is one of the most commonly used procedures for determining whether an association (relationship) exists between two variables of a population if we have the bivariate data. Association is usually measured by correlation and by Chi-Square Independence test.
Two variables of a population are associated if knowing the value of one of the variables imparts information about the value of the other variable. Simply, this means that the values of one variable generally co-occur with certain values of the other variable.
For instance, a researcher wants to examine the relationship between gender (male vs. female) and empathy (high vs. low). Or, a researcher wants to know the relationship between marital status and alcohol consumption. The frequency of each category for one nominal variable is compared across the categories of the second nominal variable.
The assumptions of the Chi-Square Independence test are similar to the assumptions of the chi-square goodness of fit. The assumptions of the Chi-square include:
All expected frequencies are 1 or greater.
The two variables should be categorical (ordinal or nominal).
At most 20% of the expected frequencies are less than 5.
All observations are independent and randomly sampled.
Example: Marital Status & Drinking
A national survey was conducted to obtain information on the alcohol consumption patterns of U.S. adults by marital status. A random sample of 1772 residents 18 years old and older yielded the data displayed in Table 1. Suppose we want to use the data in the table to decide whether marital status and alcohol consumption are associated.
Table 1: Contingency table of marital status and alcohol consumption for randomly selected adults
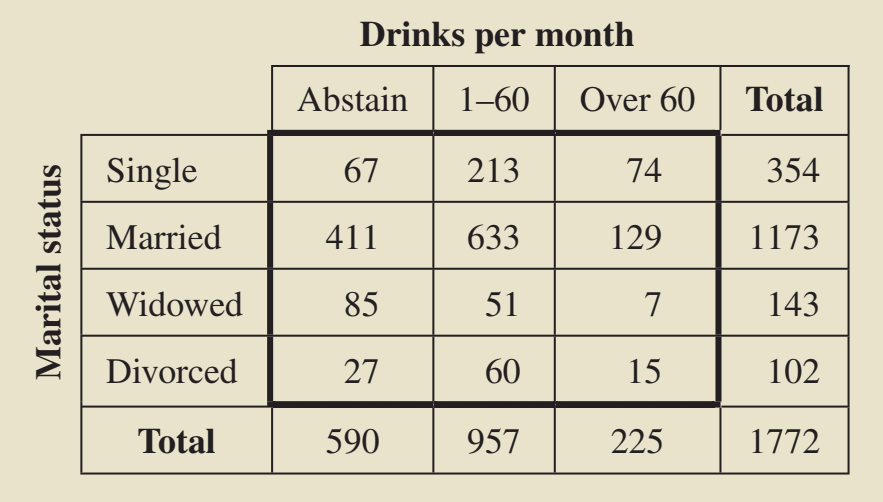
Source: Weiss, N. A., & Weiss, C. A. (2012). Introductory Statistics (9th ed.)
For a chi-square independence test, the null hypothesis is that the two variables are not associated; the alternative hypothesis is that the two variables (the marital status and alcohol consumption) are associated. Therefore, we want to perform the following hypothesis test:
H0: Marital status and alcohol consumption are not associated.
Ha: Marital status and alcohol consumption are associated.
The idea behind the chi-square independence test is to compare the observed frequencies in Table 1 with the frequencies we would expect if the null hypothesis (non-association) is true. Therefore, We need to compute the expected frequency (E) for each observed frequency (O) in the previous table and to construct the following table. To do so, we can use the following formula (Figure 2):
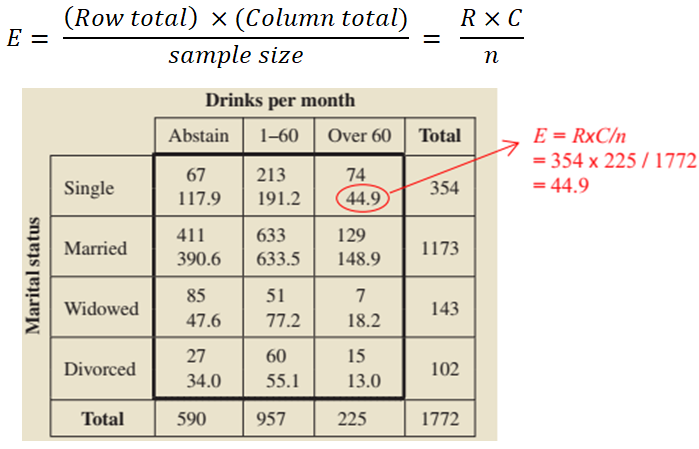
Figure 2: Observed and expected frequencies for marital status and alcohol consumption (expected frequencies are printed below observed frequencies).
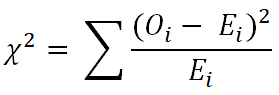
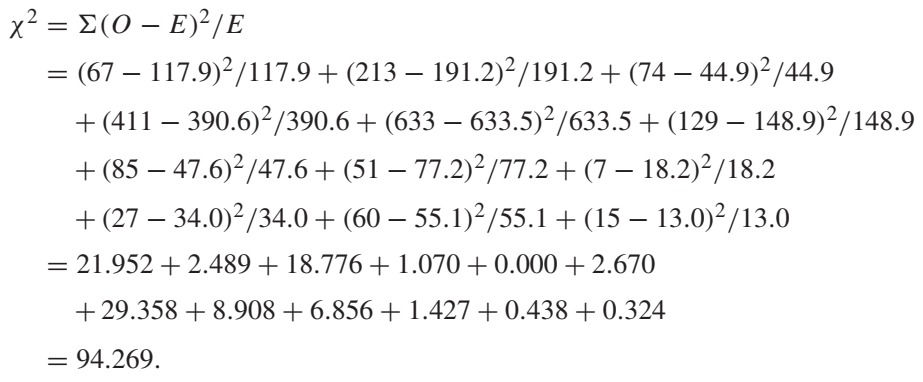
Now, we can calculate the chi-square value (χ2) by the following formula:
Now, we need to calculate the degree of freedom (df). The number of marital status categories (row) is four (r = 4), and the number of drinks-per-month categories (column) is three (c = 3). Therefore:

Based on the df value we can now obtain the critical chi-square value from a table known as "Chi-Square Distribution Table" and since the alpha level of significance is α = 0.05, the critical value = 12.592.
From the previous results, it can be noticed that the calculated chi-square value (94.296) is higher than the critical chi-square value (12.592), therefore we can reject the null hypothesis (H0) and accept the alternative hypothesis (Ha) and we can say that at the 5% level of significance, marital status and alcohol consumption are significantly associated.
Keep in mind that association does not imply causation. For instance, the result of the previous example means that knowing the marital status of a person imparts information about the alcohol consumption of that person, and vice versa. But, it does not necessarily mean that being single causes a person to drink more. In other words, association is a necessary but not sufficient condition for causation.
Phi coefficient
Note that in the previous example the chi-square significant results indicates that a significant association (correlation) between the two variables but we did not know the size of this correlation. To do that, we have to calculate the phi coefficient (Φ).
The phi coefficient is similar to the correlation coefficient in its interpretation. The phi coefficient value can be between 0 and 1. A coefficient of zero (0) indicates that the variables are perfectly independent. The larger the coefficient, the closer the variables are to forming a pattern that is perfectly dependent which is 1.
Several statistical analysis software can calculate the Chi-square value (χ2) and phi coefficient (Φ) for you. Note that the value of phi coefficient varies according to your study design which maybe 2x2, 2x3, or 3x3 and so on.
References
Heiman, G. W. (2011). Basic Statistics for the Behavioral Sciences (6th ed.). USA: Cengage Learning.
Samuels, M. L., Witmer, J. A., & Schaffner, A. (2012). Statistics for the Life Sciences (4th ed.): Pearson Education, Inc.
Weiss, N. A., & Weiss, C. A. (2012). Introductory Statistics (9th ed.): Pearson Education, Inc.
Mendenhall, W. M., & Sincich, T. L. (2016). Statistics for Engineering and the Sciences Student Solutions Manual (6th ed.). USA: Taylor & Francis Group, LLC.


Comments