
The t-test - Comparison of Two Sample Means
- Hussam Omari
- Mar 30, 2022
- 5 min read

Updated: Jan 24, 2023

Generally speaking, the t-test, also known as the student’s t-test, is a type of inferential statistics used to determine if there is a significant difference between the means of two groups. In more accurate description, the t-test is used to test whether the two means of two groups are from different populations (statistically different) or from same population (statistically similar).
We can also compare two means by finding a confidence interval for the difference between them. One important aspect of that inference is the interpretation of the confidence interval for the difference (μ1 − μ2).
Hypothesis Testing
A statistical hypothesis testing is the process of expressing an assumption to help us decide whether our data sufficiently support our hypothesis. It helps us to decide whether the data is consistent with the experimental hypothesis or not.
We formulate the hypothesis before test calculations such as t-test. This hypothesis is simply a prediction statement also known as experimental or research hypothesis which is a statement about the relationship or difference between groups that we want to test. This prediction statement is based on the experimental hypothesis, which is a claim or assumption about the population. In other words, we translate our experimental hypothesis into statistical hypothesis.
The statistical hypothesis test includes two statements or hypotheses; the null hypothesis and alternative hypothesis.
The null hypothesis (H0) is the the hypothesis to be tested. This hypothesis assumes that there is no difference or no relationship between groups — the group means are statistically equal. Hence we can express the null hypothesis as

This means that any differences or similarities observed in the sample data are likely due to chance and not due to any underlying relationship or difference in the population and the results of the hypothesis test do not provide enough evidence to reject the null hypothesis in favor of the alternative hypothesis.
The alternative hypothesis (Ha) is the alternative to the null hypothesis. This hypothesis assumes that there is a difference between groups. Three choices are possible for the alternative hypothesis:
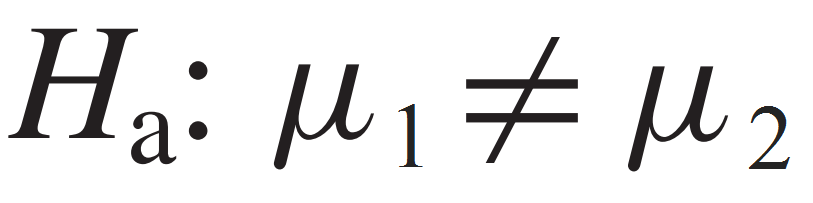
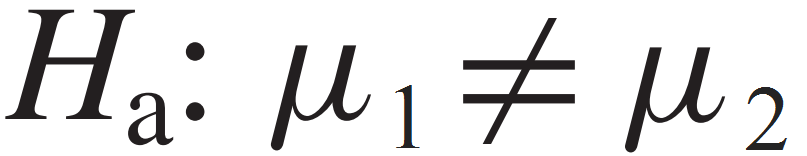
If the primary concern is deciding whether a group mean (μ1) is statistically not equal to another mean (μ2); two-tailed test, then we express the alternative hypothesis as:
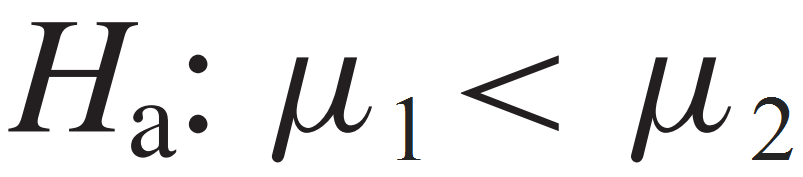
If the primary concern is deciding whether a group mean is statistically less than another mean (lift-tailed test), we express the alternative hypothesis as:
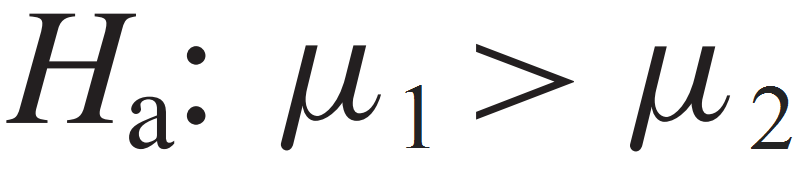
If the primary concern is deciding whether a group mean is statistically higher than another mean (right-tailed test), we express the alternative hypothesis as:
Understanding the t-test
In fact, the t-test (the t-distribution) is similar to the z-test (z-distribution), in which both t- and z-test are used for significance testing in a one-sample experiment contains two groups (Figure 1). However, in z-test we need to know the standard deviation of the population. In this context, the population is the one that we randomly take the sample from.
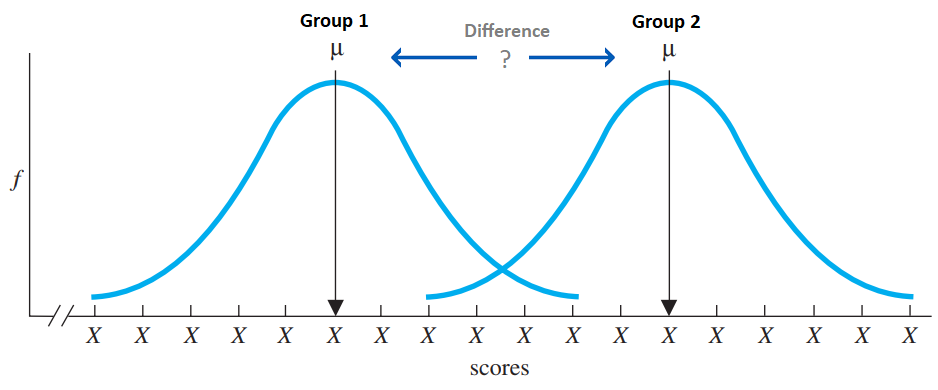
Figure 1: A representation of the t-test basic logic
When reading the t-test results, we mainly care about three values:
The means of the two groups; to know which one of the two groups have a higher or lower mean.
The t-score (t-value) which is the ratio between the difference between two groups and the difference within the groups. The larger the t-score, the more difference there is between groups. The smaller the t-score, the more similarity there is between groups.
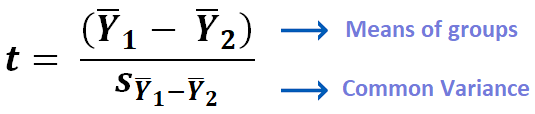
The third value is the probability value (p-value) which tells us if the difference value (t-value) is really significant or not.
Types of t-test
There are three main types of t-test:
Independent Samples t-test; compares the means for two groups.
Paired sample t-test; compares means from the same group at different times.
One sample t-test tests; compares the mean of a group with a single known mean of another group.
Independent Samples t-test
In this article, we explain the most common t-test which is used to compare two independent sample (groups) means; therefore, it is called independent samples t-test. In this context, independent means both groups have no relationship that make them affect each other. This means that:
Subjects in the first group cannot also be in the second group.
No subject in either group can influence subjects in the other group (no relationship).
The data sample is randomly selected.
Homogeneity of variance; means that the variances is almost equal (statistically equal) across the two groups.
When your data meets these key assumptions, you can perform independent samples t-test. Many statistical software and programming languages, such as SPSS, SAS, R and Python, can perform such test analysis for you and provide you with all needed values.
Example: Suppose we have an experiment concerning a drug content assessment and we have a dataset, named DRUGCON, contains a drug concentration of 50 tablets produced in two different sites; 25 from the first site (group 1) and 25 from another site (group 2). We need to know whether there is a significant difference between the mean drug concentration of the two groups.
Before conducting the data analysis using a statistical software (e.g. SPSS) to find whether there is a significant difference between the two groups means or not, we first need to formulate the null and the alternative hypothesis.
Note that the primary concern is deciding whether the mean of the group 1 (μ1) is statistically not equal to the mean of the group two (μ2), therefore our t-test is two tailed test and our hypothesis test is as follows:

The t-test results, shown in Figure 2, obtained through data analysis using SPSS software. When we we look at the mean of the two groups [in green]. We observe that the mean drug concentration in the tablets of site 1 (group 1) is slightly higher than site 2 (group 2).
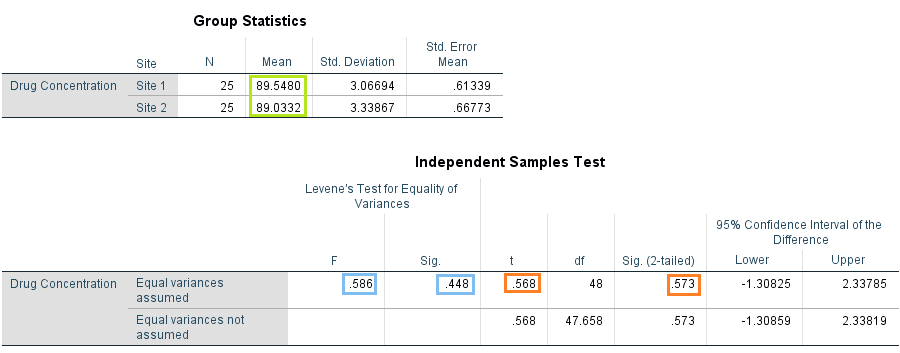
Figure 2: The t-test results obtained through data analysis using SPSS software
To know if this difference between the two means is really significant or not, we first look at the F value of Lavene's Test and its Sig value (in blue); since Sig value of F (0.448) is higher than 0.05, the F is not significantly differ at 95% level, therefore we assume that the variances of both groups are equals and we continue reading the first line which contains the t value and its Sig value [in red].
It can be observed that the Sig value of t is 0.573 which is higher than 0.05; this indicates that the means of both groups are statistically equal and no significant difference were found between the means.
References
Mendenhall, W. M., & Sincich, T. L. (2016). Statistics for Engineering and the Sciences Student Solutions Manual (6th ed.). USA: Taylor & Francis Group, LLC.
Heiman, G. W. (2011). Basic Statistics for the Behavioral Sciences (6th ed.). USA: Cengage Learning.
Samuels, M. L., Witmer, J. A., & Schaffner, A. (2012). Statistics for the Life Sciences (4th ed.): Pearson Education, Inc.
Weiss, N. A., & Weiss, C. A. (2012). Introductory Statistics (9th ed.): Pearson Education, Inc.


Comments