
Statistical Analysis Using SPSS: One-way ANOVA
- Hussam Omari
- Nov 7, 2022
- 4 min read

Updated: Dec 26, 2022

Table of Contents
What is SPSS?
SPSS (Statistical Package for the Social Sciences) is one of the most used statistical analysis tools. It was originally launched in 1968 by SPSS Inc., and was later acquired by IBM in 2009.
SPSS software is used by various kinds of researchers and institutions for statistical data analysis such as government entities, educational institutions, survey companies, market researchers, marketing organizations, health researchers, data miners, etc.
In this article, we will perform a one-way analysis of variance (ANOVA) for independent groups in SPSS and how to interpret the ANOVA and multiple-comparison (LSD) test results.
Understanding the Data
The dataset are used in this analysis consists of 16 corn plant heights. Each 4 plants were sprayed with a specific concentration of a liquid fertilizer (amino acids). The concentrations used were: 0ml/L, 1ml\L, 2ml/L, and 3ml/L, as shown in Figure 1.

Figure 1: Corn plants data
You can download the dataset on your computer by clicking on the following file:
Note that our data has a one independent variable or factor (amino acid fertilizer) and this factor has four levels (treatments); 0, 1, 2, 3 ml/L. Each treatment is applied to 4 plants (replicates). Therefore, we have 4 groups.
The independent variable is a factor that manipulates or affect the independent variable (plant height). Therefore, in this study, the plant height measurement is considered a response to the growth stimulant concentrations effect.
ANOVA in SPSS
Before starting the analysis, we should identify clearly our objective(s) or question(s) that we need to be answered through data analysis.
Here, our objective is to investigate whether the liquid amino acids fertilizer affects corn plant height or not. Also, which one of the fertilizer concentrations has the significantly the greatest impact on corn plants height.
To fulfill our objectives, we need to conduct a statistical analysis test called as Analysis of Variance (ANOVA).
Step 1: Importing the Data
Usually we import the data to SPSS using two methods:
1. From the menu, choose File > Import Data > Excel, as shown in Figure 2, then a dialog box “Open Data” will appear. Locate and select the Excel file, then click Open. You can also drag and drop an existing file directly into an open SPSS window.

Figure 2: Importing data in SPSS
2. You can insert the data variables manually in the "Variable View" window, as shown in Figure 3, and then copy the data values from the Excel file and past in the "Data View" window in SPSS, as shown in Figure 4.

Figure 3: SPSS Variable View window

Figure 4: SPSS Data View window
Step 2: Performing the Analysis
Since we imported the data to the "Data View" window, now we can easily perform ANOVA and LSD test. To do so, click on Analyze -> Compare Means -> One-Way ANOVA, as shown in Figure 5.
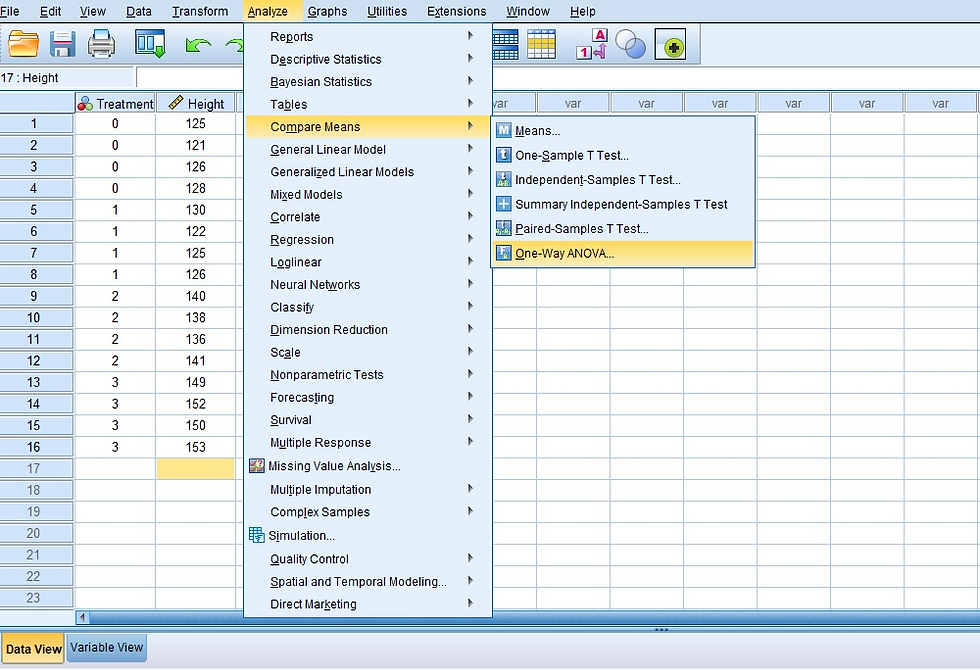
Figure 5: Analyze > Compare Means > One-Way ANOVA
Now, drag and drop your independent variable (Treatment) into the "Factor" box and dependent variable (Height) into the "Dependent List" box, as shown in Figure 6.

Figure 6: One-Way ANOVA dialogue box
Then, click on "Post Hoc" button, select "LSD", and press "Continue", as shown in Figure 7.

Figure 7: One-Way ANOVA Post Hoc Multiple Comaprisons
After that, SPSS will show the previous "One-way ANOVA" window, click on "Options" button, select "Descriptive", and press "Continue", as shown in Figure 8.

Figure 8: One-Way ANOVA Options
Now, you are ready, Press the "OK" button, and your result will pop up in the "Output viewer", as shown in Figure 9.

Figure 9: SPSS Output Viewer
SPSS Results Interpretation
In the "Output viewer" window (Figure 9), 3 tables are shown (Descriptives, ANOVA, and Multiple Comparisons).
1. The Descriptives table shows the essential descriptive statistics including the mean and standard deviation of each group of plants that receives same fertilizer concentration (Figure 10). We can notice that control plants (0ml/L fertilizer) has the lowest height value, and the plants height increased as the fertilizer concentration increased.

Figure 10: SPSS Descriptives table
2. The ANOVA table tells us whether there is a statistical significant difference between the plants height means or not. Since the Sig. value (p-value) is less than the critical value (0.05). This indicates that at least one of the groups' mean under study are significantly differ from other groups' means (Figure 11).

Figure 11: SPSS ANOVA table
3. We Know that a significant difference between means is existed, but now we need to know which mean is significantly different from others and which mean is not. Therefore, we need to look at the Multiple Comparisons table (Figure 12).

Figure 12: ANOVA Multiple Comparisons (LSD) table
We can notice that all plants height means are significantly different from each other (Sig. < 0.05) except the plants that were sprayed with 1ml/L which is not significantly different (Sig. > 0.05) from the control plants (0 fertilizer).
Data Visualization
For research papers, we can represent the results data in APA table format using Microsoft Word and showing the means denoted with a subscription letter (a, b, and c) as follows:
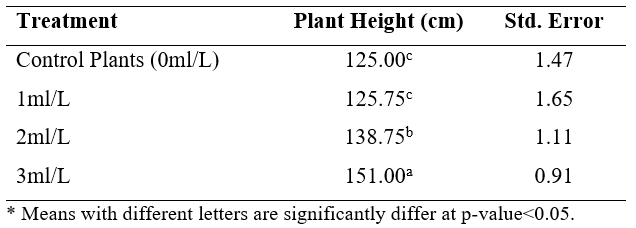
Notice that the highest mean value is denoted with a letter, while the lesser mean value is denoted with b and so on. Also, we denote plants treated with 1ml/L and control plants with the same letter (c) because they are not significantly different as shown previously in the Multiple comparisons table.
We can also represent the data with Excel bar chart as shown in Figure 13:

Figure 13: Representing data analysis results with bar chart
Conclusions
This article shows how to perform a one-way analysis of variance (ANOVA) for independent groups in SPSS and how to interpret the ANOVA and multiple-comparison (LSD) test results.
We used a comprehensive example to show how to perform ANOVA using SPSS. The objective of the data analysis of the example was to investigate whether the liquid amino acids fertilizer (growth stimulant) affects corn plant height or not. Also, which one of the fertilizer concentrations has the significantly the greatest impact on corn plants height.
The analysis results of corn plants data revealed that the liquid amino acids fertilizer significantly affected corn plants height. All corn plants sprayed with 3 and 2ml/L respectively showed a significant increase in height compared to plants sprayed with 1 and 0ml/L. Plants sprayed with 3ml/L showed the highest plants height mean, whereas the control plants were the lowest.


Comments